
Housing Ownership Has Remained Relatively Affordable Over The Past Year
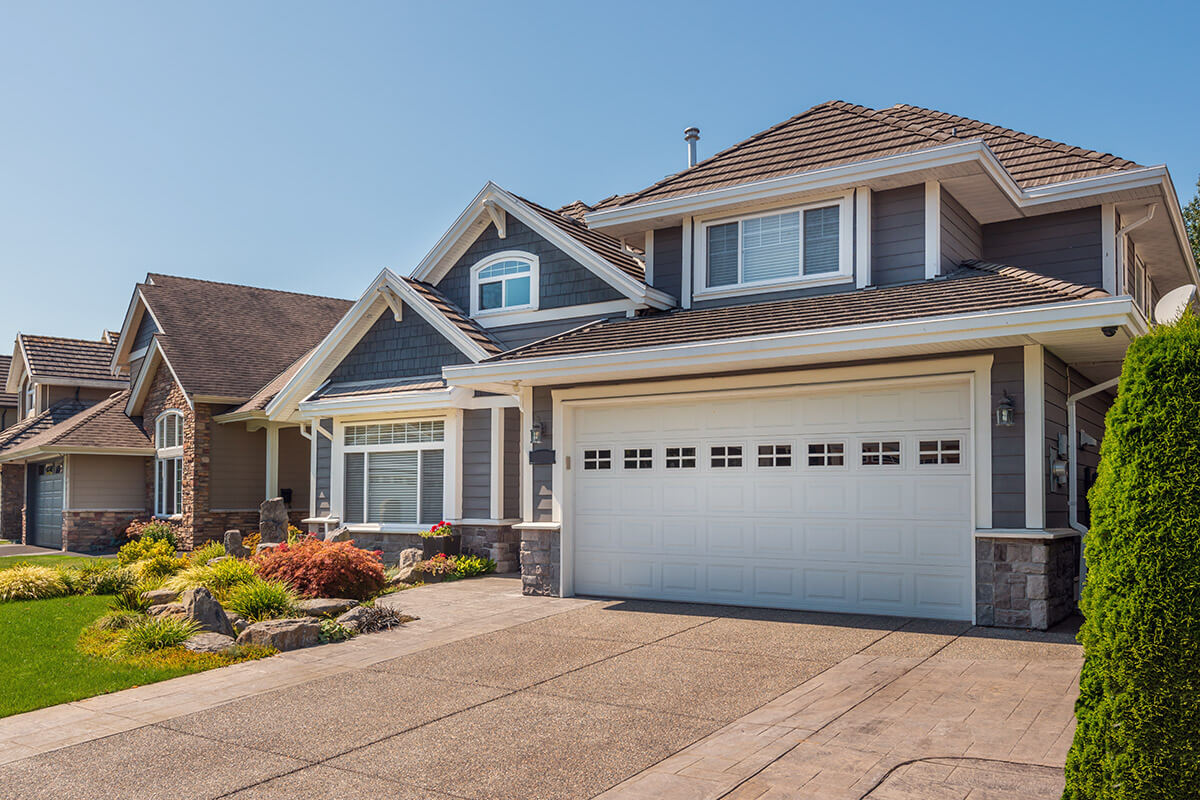
Housing ownership has remained relatively affordable over the past year, with average prices dipping and mortgage rates remaining somewhat flat. Recent news on the overall economy and job creation has been positive. The main hold-back for many households has been concerns around trade with the United States and the potential for higher inflation and borrowing costs in the future.
Ontario - Ownership Housing Has Remained Relatively Affordable Over The Past Year
Toronto, 04 Sept, 2026 -- The number of homes available for sale in August 2026 was down noticeably compared to last year in the Greater Toronto Area (GTA). Following this trend, home sales also edged lower, as the number of transactions was arguably limited by less choice in some neighbourhoods. Less choice and more competition between buyers could ultimately result in renewed price growth in the months ahead.
GTA REALTORS® reported 5,057 home sales through TRREB’s MLS® System in August 2026 – down 2.1% compared to August 2025. New listings entered into the MLS® System amounted to 12,075 – down by 14.1% year-over-year.
On a seasonally adjusted basis, August 2026 home sales were down slightly month-over-month compared to July 2026, while new listings were up.
“If inventory tightens and home prices begin to rise, some buyers may face a trade-off between waiting for greater economic certainty and purchasing before prices move higher. At the same time, improving market conditions for sellers could bring more listings to market, providing buyers with additional choice,” said Toronto Regional Real Estate Board (TRREB) President Daniel Steinfeld.
The MLS® Home Price Index (MLS® HPI) Composite benchmark was down by 4.5% year-over-year in August 2026. The average selling price, at $993,410, was down by 2.7%.
On a month-over-month seasonally adjusted basis, MLS® HPI Composite was essentially flat compared to July 2026. The average selling price edged up over the previous month.
“Ownership housing in the GTA has remained relatively affordable over the past year, with average prices dipping and mortgage rates remaining somewhat flat. Recent news on the overall economy and job creation has been positive. The main hold-back for many households has been concerns around trade with the United States and the potential for higher inflation and borrowing costs in the future,” said TRREB’s Chief Information Officer Jason Mercer.
“A more balanced resale market is a positive development, but it does not address Ontario’s ongoing housing supply and affordability challenges. Governments should take advantage of this opportunity to eliminate barriers to attainable housing, including restrictive zoning policies, high taxes and development charges, and lengthy approval processes. Municipalities, in particular, play a significant role in determining how much housing is built, how quickly projects move forward, and the overall cost of delivering homes,” said TRREB CEO John DiMichele.
Ottawa Home Sales Pull Back Sharply in August While Prices Hold Steady
Ottawa, Sept 3, 2026 -- Ottawa’s housing market lost momentum in August. Sales declined sharply both year over year and from the previous month, reversing July’s incremental improvement and widening the year-to-date gap compared with 2025.
The slowdown was not driven by a new influx of supply. New listings and active listings both declined from July, but sales fell much faster, weakening the relationship between available supply and demand. Listing activity also suggests that some sellers may be pausing or reassessing their plans, rather than proceeding under current conditions. Months of inventory rose to its highest August level since 2016.
Pricing remained comparatively stable. The average sale price and composite benchmark price were both slightly higher than a year earlier, while the median price declined modestly. Overall, August presents a softer picture heading into the fall market, with mixed indicators of market strength and weakness.
“Prices remained relatively steady despite the pullback in sales, which tells us this is not a simple story of the market moving uniformly in one direction,” said OREB President Tami Eades. “Buyers are seeing less competitive conditions and have more time to make decisions, while sellers are facing more competition and may need to be thoughtful about pricing and positioning their homes for the current market. One month does not establish a trend, but the shift in sales and inventory is something we’ll be watching closely as we head into the fall market.”
Residential Market Activity
A total of 1,002 homes were sold through the MLS® System in August, down 18.6% from August 2025. Sales also declined 24.4% from July. By comparison, the median July-to-August decline over the previous 10 years was 5.8%, confirming that this year’s slowdown was substantially larger than normal seasonal variation. The August total tied 2022 for the lowest August sales count since 2016.
The sales decline extended across all three major property types:
Single-family sales fell 16.3% year over year to 535 transactions.
Townhouse sales fell 19.9% to 310.
Apartment sales fell 22.3% to 136.
This broad-based weakness differs from earlier months, when the softer activity was more concentrated in townhouses and apartments.
Year to date, 9,283 homes have sold in Ottawa, down 6.9% from the same period in 2025. The year-to-date shortfall widened from 5.2% at the end of July, reversing the incremental improvement recorded last month. Total year-to-date dollar volume was approximately $6.5 billion, down 7.2% year over year.
Prices and Market Balance
The average residential sale price was $688,253 in August, up 0.3% from a year earlier and 0.7% from July. The median price was $622,357, down 1.2% year over year and 2.0% from July.
The MLS® Home Price Index, a measure less affected by changes in the types of properties sold, recorded a composite benchmark price of $637,700. This was 1.0% higher than in August 2025 and 0.6% higher than in July. Taken together, the price measures indicate that values were considerably steadier than sales activity.
There were 2,119 new listings in August, unchanged from a year earlier and down 16.2% from July. Active listings totalled 4,496, up 11.3% year over year but down 3.9% from July. The monthly declines in new and active listings were broadly consistent with seasonal patterns, but active inventory remained at its highest August level since 2016.
The decline in active listings should not be interpreted as inventory being absorbed primarily through sales. An OREB review of listing records indicates that terminations, cancellations and expirations became more prominent relative to completed transactions through the summer. Although these non-sale removals declined from July, sales fell more sharply, meaning a greater proportion of properties left the market without producing a sale. One explanation for this behaviour could be that some sellers may be stepping back or reassessing their plans to sell under current conditions.
The sales-to-new-listings ratio fell from 52.4% in July to 47.3% in August as sales declined faster than new listings. Months of inventory increased from 3.5 to 4.5. Over the previous 10 years, the median July-to-August change in months of inventory was zero, and no increase exceeded 0.4 months. This year’s one-month jump in MOI therefore represents a meaningful weakening in absorption rather than a typical summer movement.
Other transaction measures changed only modestly. Homes sold for an average of 97.9% of their listing price, unchanged from August 2025, while the median time on market increased from 28 days last August to 29 days. These figures remain consistent with broadly balanced conditions, despite the softening of other indicators.
Single-family homes remained the most stable major segment. The single-family benchmark price rose 2.2% year over year, while months of inventory reached 4.0. Townhouses recorded 4.1 months of inventory, with active listings 27.1% above last year and a benchmark price 4.0% lower year over year. The weakening of the townhouse market is something worth monitoring closely.
Of all the property segments, apartment conditions remained the softest in August, continuing the pattern observed throughout 2026 and the second half of 2025. Apartments recorded 6.3 months of inventory, a 43.0% sales-to-new-listings ratio and a median of 42 days on market. However, active apartment listings declined from July, the sales-to-new-listings ratio improved slightly and the apartment benchmark rose 1.9% month over month. The August figures therefore show continued softness, but not a decisive new deterioration.
Alberta - Sales and new listings slow in August
Calgary, Sept 1, 2026 – Consistent with trends throughout most of 2026, both sales activity and the number of new listings coming onto the market have continued to trend down compared with 2025 levels. In August, sales in Calgary were 1,660 units, down 16% compared with last year, while new listings fell by nearly 10% to 3,141 units.
The pullback in sales has not occurred across all price ranges, as homes priced over $1,000,000 have recorded gains over last year. These gains have mostly been driven by detached and semi-detached homes and are also consistent with where most of the supply growth has occurred.
“While sales growth in the upper end of the market was possible thanks to improved supply choice, it also reflects longer-term confidence in our market, as some buyers are not shying away from taking advantage of the available supply,” said Ann-Marie Lurie, Chief Economist at the Calgary Real Estate Board (CREB®). “Meanwhile, we have not seen the same pickup in activity in the lower price ranges, as favourable rental conditions are slowing the transition to ownership.”
Inventory levels in August eased compared with the previous month and the same period last year, at 6,509 units. However, given the pullback in sales, the months of supply pushed up to nearly four months. Also consistent with trends throughout this year, conditions vary significantly by property type, with nearly six months of supply for apartment-style homes compared with over three months of supply for lower-density detached homes.
The relatively balanced conditions in the detached and semi-detached sector have prevented any significant shifts in prices compared with the steady price declines occurring in the oversupplied higher-density segments of the market. As of August, the total residential benchmark price was $569,800, similar to the previous month and one% lower than 2025 levels.
Detached - Gains in higher-priced sales were not enough to offset the pullbacks occurring for homes priced below $1,000,000, as sales fell by 12% to 875 units. At the same time, new listings trended down compared with both July and August 2025 levels, reaching 1,635 units. The steeper decline in sales compared with inventory levels was enough to support a modest monthly gain in inventory levels and drove up the months of supply to over three months. Market balance varies significantly based on price range and location. The months of supply remain below three months in the North West, West, South and South East districts, and above four months in the North and North East districts. The wide range of market balance is also reflected in pricing. Year-over-year gains of over two% have occurred in the West and City Centre districts. Meanwhile, price declines were the steepest in the North East at over six%. Overall, the benchmark price in August was $744,300, similar to July and down by one% compared with last year.
Semi-Detached - Easing sales in August were enough to push year-to-date sales down to 1,516 units, over two% lower than last year’s levels. The easing of August sales was not matched by new listings, causing the sales-to-new-listings ratio to fall to 56%. While inventories eased slightly compared with the previous month, they remain nearly five% higher than last year. The steeper monthly pullback in sales compared with inventories was enough to push the months of supply above three months, the first time this has happened since January. Despite the shift, conditions remain relatively balanced, and prices have been relatively stable. As of August, the unadjusted benchmark price was $690,500, similar to the previous month and nearly one% higher than last year's levels. Price gains in the City Centre, North West and West districts offset pullbacks in other areas, contributing to the annual gain.
Row - Sales continued to ease in August compared with last year, contributing to the year-to-date pullback of 15%. Additional new-home supply, along with more rental product availability, has contributed to some of the pullback in sales activity. Meanwhile, the pullback in new listings has helped prevent any further gains in inventory levels, and the months of supply remained near four months for the second month in a row. Like other sectors, conditions vary depending on location. The months of supply pushed above four months in the City Centre, North East and North districts, while remaining near three months in the West district. Prices have been easing across all districts in the city. The range of decline varied from over 12% in the North East to just over one% in the North West district. As of August, the benchmark price was $415,200, down nearly one% from July and five% lower than levels reported last year at this time.
Apartment Condominium - Apartment-style homes continue to face the most oversupply in the market, with nearly six months of resale supply. More rental supply is weighing on ownership demand from both first-time buyers and investors, which is slowing sales activity while supply levels remain elevated. In August, sales activity continued to fall, contributing to the year-to-date decline of 26%. New listings have also been declining enough to prevent any further inventory gain, but not enough to help the market shift away from buyer-market conditions. Persistently high supply levels relative to demand have weighed on apartment-style prices for the past two years. As of August, the unadjusted benchmark price was $295,400, nearly one% lower than the previous month and eight% lower than 2025 levels. Prices peaked in August 2024 at $341,300 and currently sit nearly 13% lower than the peak price.
British Columbia - Slow but Steady Sales Recovery Continues in the BC Market
Vancouver, Sep 14, 2026 -- The British Columbia Real Estate Association (BCREA) reports that 5,653 residential unit sales were recorded in Multiple Listing Service® (MLS®) Systems in August 2026, down 4.7% from August 2025. The average MLS® residential price in BC in August 2026 was down 1% at $924,826 compared to $925,917 in August 2025.
Total MLS® residential sales dollar volume was $5.2 billion, down 4.8% from the same time the previous year. BC MLS® unit sales were 25.4% lower than the ten-year average for the month of August.
“Provincial home sales remain well below long-term averages but have been steadily improving throughout the year,” said BCREA Chief Economist Brendon Ogmundson. “We expect a gradual recovery in sales to continue, though new tariffs and a recent spike in long-term interest rates add a layer of risk to that scenario.”
Year-to-date, BC residential sales dollar volume is down 6.5% to $43.26 billion, compared with the same period in 2025. Residential unit sales are down 5.5% year-over-year at 46,069 units, while the average MLS® residential price is down 1% to $939,028.